This artifact is a math unit plan I developed and taught to my students during my time student teaching about comparing sets, data, and graphing. Although we are generally expected to cover the material in the Houghton Mifflin Math Series that all of Kindergarten uses for Math at Kelly Elementary, I was able to develop lesson plans that deviated at times from the set procedures in the Houghton Mifflin Math book while still meeting the math objectives laid out in the chapter. Having this flexibility allowed me to combine lessons when the class was picking up certain concepts at a fast pace, create new challenges, and include activities related to student interest.
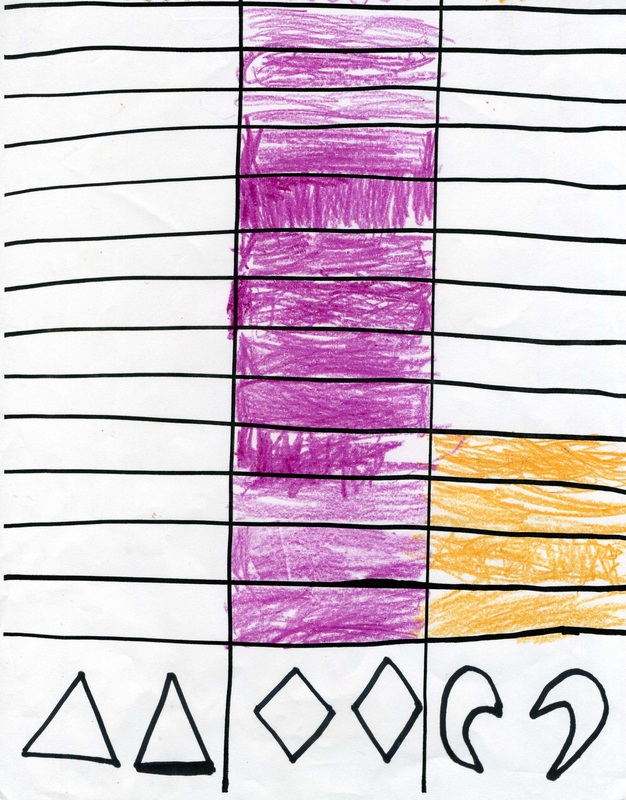
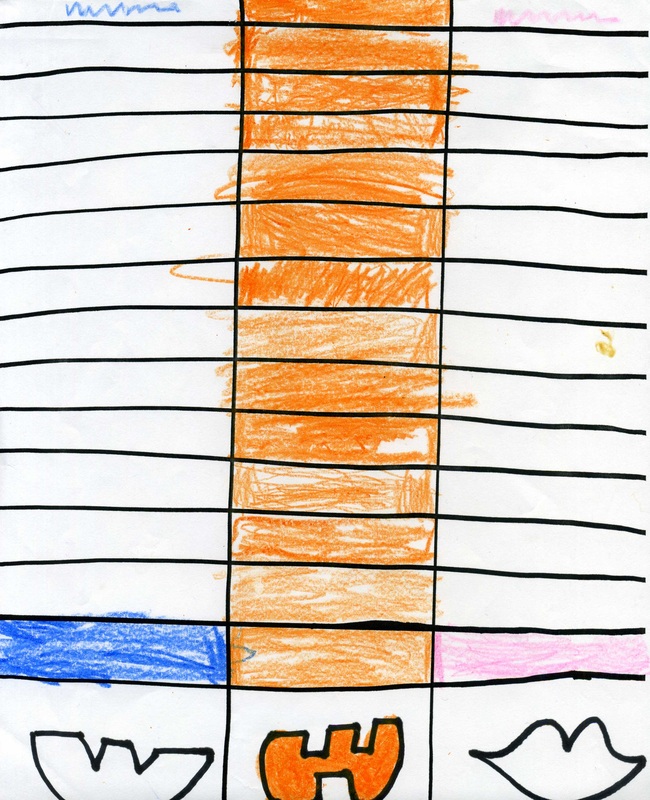
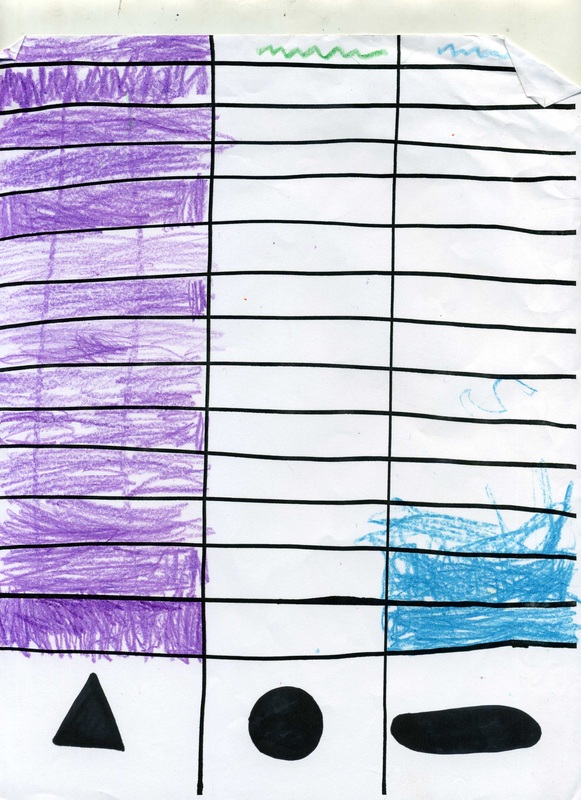
When I began teaching this chapter, my students had already shown an interest in graphs when we did our weather bar graph every morning during calendar. Many of the other grades at Kelly were learning about graphs when we started this unit, and so to spark student interest and give my students the opportunity to see a variety of graphs I took them on a "walking tour" of the school to view graphs other classes had posted in the hallway. Another activity I did with my students that connected to what they were learning about in science at the time (pumpkins) and the field trip to the pumpkin patch that we had just gone on was use bar graphs to "vote" on what shape eyes, nose, and mouth we should carve our class pumpkin. This lesson was highly successful and the students were eager to see which shapes had "won". Students also had multiple opportunities to take ownership of their learning by creating their own bar graphs to show how many of each skittle color they had in a miniature skittles packet and to brainstorm as a class other information about the class they wanted to find out and then used a graph to answer their question.
The artifact posted below is an example of my competency in planning because it shows how I am able to make lesson plans that are relevant and interesting to students' lives and that tie in to other subject areas and disciplines so that students are able to gain a broader sampling of the material and its application in more than one area.
Comparing Sets, Data, and Graphing Unit Link
|
|
|
Bar graphs students made as class during this unit to vote on what shape eyes, nose, and mouth we should carve on our class pumpkin
|
